كيف تصمم ”إنفوغرافا“ احترافيا؟

كيف تصمم ”إنفوغرافا“ احترافيا؟

 الإنفوغرافيك (information graphic) هو فن تحويل البيانات والمعلومات إلى صور ورسوم يسهل فهمها بوضوح، وإضفاء شكل آخر لعرض هذه المعلومات والبيانات بأسلوب جديد يبسّط الأرقام المعقدة ويعرضها بطريقة جميلة ومهذبة، فاجتهادات المصممين وكاتبي محتوى الإنفوغراف تنصب في نقطة أساسية هي تحويل الفوضى المعلوماتية إلى رسم جمالي منظم يشرح نفسه بنفسه، دون اللجوء إلى شرح خارجي.

تاريخ الإنفوغراف

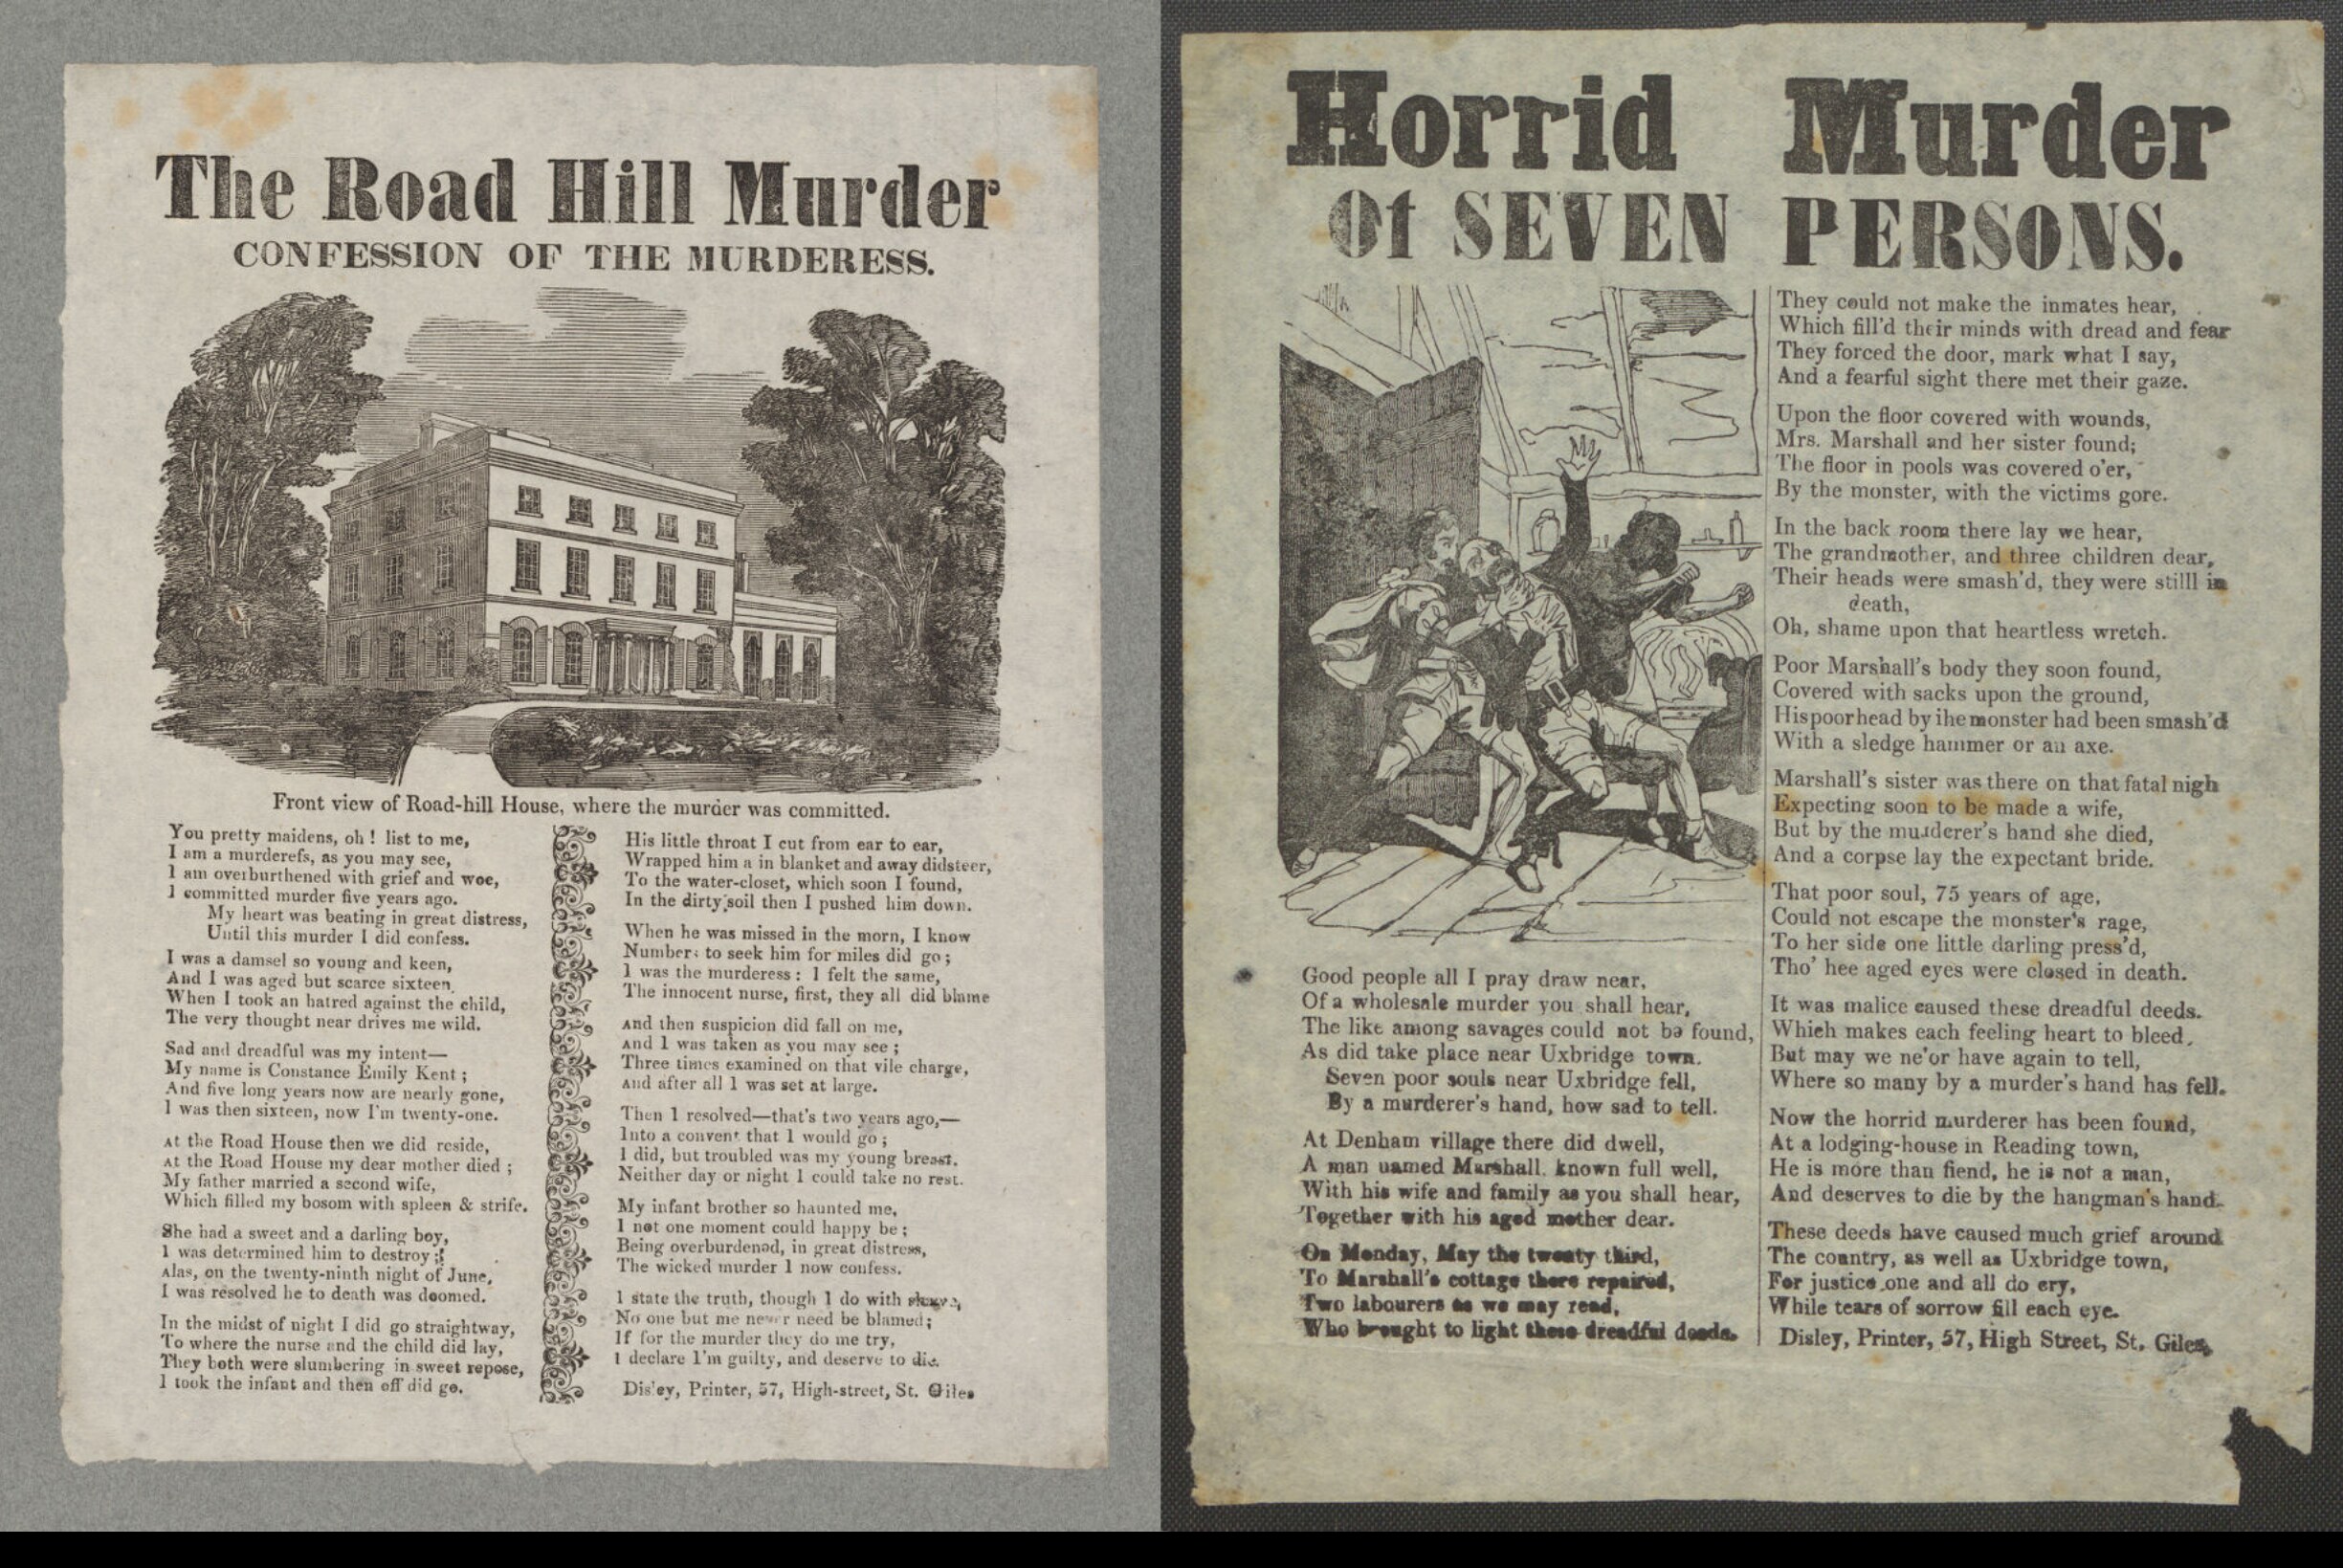
على الرغم من أن الرسوم البيانية اكتسبت مؤخرا شعبية واسعة عبر الإنترنت، فإنها موجودة فعليا منذ القرن السابع عشر. فالرسوم التوضيحية سبقت الكتابة كوسيلة لنشر المعلومات، ويقول البعض إن رسومات الكهوف والمراسلات القديمة قد تكون أبرز وأقدم مثال معروف. وكان الناس أيضا يرسمون الخرائط ويستخدمونها قبل ظهور اللغة المكتوبة.

اكتسبت الرسوم البيانية المطبوعة شعبية في القرن العشرين، خاصة مع انتشار الصحف على نطاق واسع. بالإضافة إلى ذلك، وابتداء من عام 1983، كتب خبير التصوير البياني "إدوارد تافت" (Edward Tufte) سلسلة من الكتب حول الرسوم البيانية، كما عرض محاضرات وورش عمل حول هذا الموضوع.

في القرن الحادي والعشرين انتقلت الرسوم البيانية إلى شكل رقمي، وساعد سرد العديد من الأمثلة التاريخية، وتعاليم "تافت"، وظهور الإنترنت في تطوير هذا الفن ونقل الرسوم البيانية بسلاسة عبر الشبكة المعلوماتية.

في عام 2010، وصلنا إلى ما نعرفه اليوم: رسومات رقمية مصممة تقدم معلومات معقدة بطريقة مبسطة، عادة ما تُنشر على المدونات أو في مقالات على مواقع الإنترنت ووسائل الإعلام.

هل من قواعد وضوابط للتصميم؟

حجم البيانات المنشورة يومياً في وسائل الإعلام دفع نحو إنشاء مؤسسات متخصصة فقط في تحليل تلك البيانات ووضعها في إنفوغراف يسهّل وصولها وقراءتها.

يمكنك ببساطة تمييز الإنفوغراف الجيد من السيئ، وهناك قواعد وخطوط عامة للتصميم، فالاجتهادات للهواة فقط، كما يقول معاوية محمد وهو مصمم غرافيكي في شركة "جيل ميديا" بإسطنبول.

يرى محمد في حديثه لمجلة "الصحافة" أن أهم قاعدة تحكم تصميم الإنفوغراف هي الاختصار، فكلما قلّت النصوص والجمل الطويلة كان العرض أفضل.

ومن الأمور الأساسية التي يجب مراعاتها عند تصميمه، الرؤية البصرية، وتناغم الألوان، وترتيب العناصروتناسب المساحات بينها، بحسب المصمم محمد. وهي نفس القواعد التي يتفق عليها المصمم والمخرج الفني عبد الله السباحي، مضيفاً إليها دقة الصور وجودة الرسومات المستخدمة. يقول السباحي إنه من غير المعقول أن يُعرَضَ الإنفوغراف بنفس مقاس الشاشة (72 بكسل)، بل لا بد أن يكون 150 بكسل على أقل تقدير، مع مراعاة عدم تصغير الصورة لتقليل الحجم، وذلك للحفاظ على الجودة.

ولا بد من مراعاة أن يتناسب عرض الإنفوغراف على الهواتف الذكية وأن يستجيب لها بسرعة وسهولة، وأن يتناسب مع تطبيقات التواصل الاجتماعي. وينتقد السباحي المصممين الذين يعمدون إلى الإنفوغراف الطويل الذي يجبر المشاهد على مواصلة النزول إلى الأسفل لرؤية المعلومات وقراءتها.

أما عن شكل المحتوى، فقد ركز السباحي على أهمية التوزيع البصري السليم، والتنسيق بين الصورة والنص، "فلا ينبغي أن تكون الصورة كبيرة والنص صغيرا، لأن ذلك يشعر القارئ والمشاهد بعدم الراحة أثناء رؤيته لذلك العرض".

وشبَّه السباحي الإنفوغراف بالغرفة التي يجب ألا تكون مزدحمة، وهنا يؤكد على أهمية توزيع مساحة العمل، وأن تكون المقاسات واحدة بين عنصر وآخر، حتى لا يصبح هناك أي خلل بصري.

وأضاف إلى ذلك أهمية إضفاء الحياة على الإنفوغراف عبر إشباع التصميم بالألوان، "فيجب ألا يكون باهتا أو رماديا إلا ما ندر إذا كانت فكرة التصميم تستدعي ذلك".

ويقول معاوية محمد إن وظيفة الإنفوغراف هي إيضاح المعلومات والبيانات وليس استعراض مهارات المصمم وقدراته عبر استخدام أدوات كثيرة وإغراق التصميم بالعناصر والرموز.

أنواع الإنفوغراف

يأتي الإنفوغراف بأنواع وأشكال مختلفة تُصمَّم بناء على الغرض والموضوع، ويساعد تحديد ذلك قبل بدء العمل في تحديد كيفية توزيع العناصر والألوان المناسبة، وطريقة عرض المحتوى والبيانات بشكل سليم.

- إنفوغراف المعلومات، ويركز هذا النوع على النص أكثر من الرسوم البيانية، ويجري فيه إدخال تحسينات على الرسم من خلال الرموز والأشكال والألوان والعناصر المرئية الأخرى، وذلك للتخفيف من طغيان الكلمات والجمل.

- المخطط الزمني، ويتناول هذا النوع الأحداث عبر ترتيب زمني، وغالباً ما يُستخدم لتوضيح تطور المنتج أو الفكرة، أو عرض تاريخ ما. ويستخدم فيه المخططات والأيقونات والصور والرسومات. وقد يكون تنسيق المخطط الزمني عموديًا أو أفقيًا أو متعرجًا. وعادة ما تكون الرسومات البيانية للخط العمودي والمتعرجة أسهل في القراءة.

- الرسم البياني، ويحتوي على رسم بياني يمثل المحور الرئيسي للمعلومات المعروضة. ويمكن إضافة الألوان والأشكال والرموز للتأكيد أو الشرح. كما تعمل المخططات في هذا النوع بشكل أفضل عند إجراء مقارنة أساسية للعناصر، وتشمل الحالات التي تكون فيها مخططات بيانية ذات صلة، كعدد الطلاب في الجامعات المختلفة، أو مقارنة لعدد متابعي تويتر لفرق الكرة الشهيرة أو السكان في مدن معينة.

- إنفوغراف الأرقام، ويمكن التعرف على المعلومات من خلال التركيز على الأرقام، كإظهار مقدار المال الضائع من خلال رمي الطعام، وكيف أثرت الحرب على بلد معين. ويمكن تصوير مثل هذه الأمثلة عبر رسم بياني تفصيلي بالأرقام، أو يمكن الاكتفاء بعرض صور وأرقام والتخلي عن الرسم البياني.

-  إنفوغراف المقارنة، ويعتمد على مقارنة أوجه التشابه والاختلاف بين اثنين أو أكثر من المنتجات أو المواقع أو الأحداث أو الإجراءات أو الأفكار أو الأفراد. وتشمل الأمثلة مقارنة بين المديرين، والإستراتيجية السابقة مقابل الإستراتيجية الحالية. وتساعد مقارنة المعلومات في تحديد إيجابيات وسلبيات عنصر أو منتج واحد أو عدة دول، وبين فترة وأخرى. وعادةً ما يُقسَّم الرسم إلى قسمين أو أكثر بناءً على عدد العناصر التي تتم مقارنتها.

More Articles

This Indian fact-checking newsroom is at the forefront of the fight against disinformation on the war in Gaza

In the digital battleground of Gaza's war, a surge of disinformation, primarily from Indian Hindu nationalists, paints Palestinians negatively, fueled by Islamophobia and pro-Israeli sentiments; yet, Alt News emerges as a crucial counterforce, diligently fact-checking and debunking these misleading narratives, even in Arabic, amidst a sea of manipulated social media content.

Meer Faisal
Meer Faisal Published on: 5 Dec, 2023
When journalism and artificial intelligence come face to face

What does the future really hold for journalism and artificial intelligence?

Amira
Amira Zahra Imouloudene Published on: 12 Oct, 2023
How to use data to report on earthquakes

Sifting through data sounds clinical, but journalists can use it to seek out the human element when reporting on natural disasters such as earthquakes

Arwa
Arwa Kooli Published on: 19 Sep, 2023
‘I had no idea how to report on this’ - local journalists tackling climate change stories

Local journalists are key to informing the public about the devastating dangers of climate change but, in India, a lack of knowledge, training and access to expert sources is holding them back

Saurabh Sharma
Saurabh Sharma Published on: 13 Sep, 2023
‘Don’t let someone else narrate your stories for you’ - travel journalists in the global south

THE LONG READ: Life as a travel journalist isn’t just for privileged Westerners ‘discovering’ quaint parts of south-east Asia and Africa

Anam Hussain
Anam Hussain Published on: 1 Sep, 2023
‘People need to stop blindly obeying the law’ - journalists fighting on the fringes in Vietnam

THE LONG READ: Imprisoned, exiled and forced to base themselves overseas, independent journalists in Vietnam are punished harshly if they publish the ‘wrong’ sort of content. Some, such as Luật Khoa tạp chí, are fighting back

headshot
AJR Correspondent Published on: 25 Aug, 2023
Ethics and safety in OSINT - can you believe what you see?

OSINT is increasingly important for journalists in a digital world. We take a look at ethics, safety on the internet and how to spot a ‘deepfake’

Sara
Sara Creta Published on: 15 Aug, 2023
‘Other journalists jeer at us’ – life for mobile journalists in Cameroon

Journalists in Cameroon are using their phones in innovative ways to report the news for many different types of media, but major news organisations have still not caught up

Akem
Akem Nkwain Published on: 1 Aug, 2023
Analysis: Could AI replace humans in journalism?

Recent advances in AI are mind-blowing. But good journalism requires certain skills which, for now at least, only humans can master

Mei Shigenobu
Mei Shigenobu Published on: 17 Jul, 2023
Understanding the pitfalls of using artificial intelligence in the news room

We’ve all been amazed by new advances in AI for news rooms. But we must also focus on ensuring its ethical use. Here are some concerns to address

KA
Konstantinos Antonopoulos Published on: 10 Jul, 2023
AI in the newsroom - how to prompt ChatGPT effectively

Interested in using ChatGPT in your work as a journalist? Here’s how to do it more efficiently

KA
Konstantinos Antonopoulos Published on: 29 Jun, 2023
AI in the newsroom - how it could work

AI is now our colleague in the newsroom and is poised to become even more helpful as it gets smarter and we see more opportunities - we look at the potential uses and problems

KA
Konstantinos Antonopoulos Published on: 22 Jun, 2023
What is ChatGPT and why is it important for journalists?

AI is taking the world by storm. In the first of a series of articles about the latest developments, we explain what it's all about

KA
Konstantinos Antonopoulos Published on: 13 Jun, 2023
'Rebuilt memory by memory' - recreating a Palestinian village 75 years after the Nakba

REPORTER'S NOTEBOOK: How it took the collective memories of several generations, painstaking interviews and a determined search through tall grass and prickly plants to recreate a destroyed community

Amandas
Amandas Ong Published on: 4 Jun, 2023
How to analyse satellite imagery

When you have a story, but still need to tie up loose ends to answer where or when a particular event occurred, satellite imagery can point you in the right direction

Sara
Sara Creta Published on: 25 May, 2023
OSINT: Tracking ships, planes and weapons

Tracking ships and planes is an increasingly valuable technique in open-source investigations carried out by journalists. In part 4 of our special series, we examine how it works

Sara
Sara Creta Published on: 18 May, 2023
Planning and carrying out an open-source investigation

Part three of our special series of articles on using OSINT in journalism. This time, follow our four steps to completing an open-source investigation

Sara
Sara Creta Published on: 9 May, 2023
What is an open-source investigation?

In the second part of our special series on using open-source intelligence in journalism, we look at what constitutes and open-source investigation

Sara
Sara Creta Published on: 4 May, 2023
Using open-source intelligence in journalism

Where once journalists relied on sources for information - also known as ‘human intelligence’ (HUMINT) - they now increasingly rely on ‘open-source’ intelligence (OSINT) gathered from the internet, satellite imagery, corporate databases and much, much more

Phil
Phil Rees Published on: 12 Apr, 2023
Getting started on your data story

In the third and final part of our special series of articles on data journalism, we look at how to work as a team and get started on a data-driven story

Mohammed Haddad
Mohammed Haddad Published on: 30 Mar, 2023
How to produce data-based stories

Follow our four steps to successful data journalism - from the story idea through to publication. Part two of our special series

Mohammed Haddad
Mohammed Haddad Published on: 23 Mar, 2023
Understanding data journalism

Data journalism is about much more than just sorting through facts and figures. In the first part of our series, we look at what constitutes data-based storytelling

Mohammed Haddad
Mohammed Haddad Published on: 16 Mar, 2023
‘Leading the voiceless’ - how low-caste Indian journalists are crowdfunding their own newsrooms

Dalit representation in Indian media organisations is very low. Some journalists from the lowest Hindu caste are finding innovative ways to start up their own news platforms

Saurabh Sharma
Saurabh Sharma Published on: 13 Feb, 2023
Virtual reality in the newsroom - placing us in the middle of the story

Journalists can use virtual reality to get a much clearer view of what is happening on the ground during conflict or other major events. This is how it works

Hadeel Arja Published on: 23 Jun, 2022